1 | # |
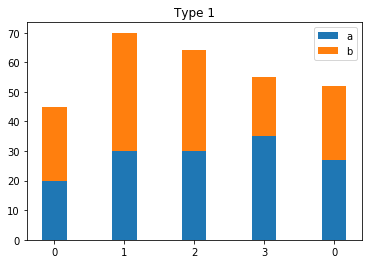
Type 1
1 | a = (20, 30, 30, 35, 27) |
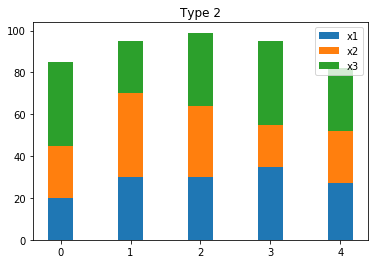
Type 2
1 | x1 = (20, 30, 30, 35, 27) |
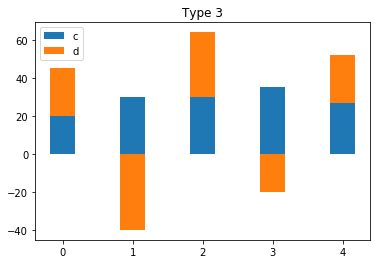
Type 3
1 | c = (20, 30, 30, 35, 27) |
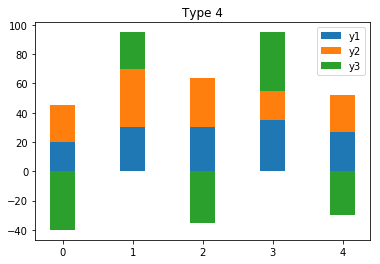
Type 4
1 | y1 = (20, 30, 30, 35, 27) |
1 | # |
1 | a = (20, 30, 30, 35, 27) |
1 | x1 = (20, 30, 30, 35, 27) |
1 | c = (20, 30, 30, 35, 27) |
1 | y1 = (20, 30, 30, 35, 27) |